| iRp | iD | spot | e | ee | fore |
|---|---|---|---|---|---|
| 0.05 | 0.03 | 15000 | 15700 | 0.0466667 | 0.0766667 |
| 0.05 | 0.03 | 15300 | 15700 | 0.0261438 | 0.0561438 |
| 0.05 | 0.03 | 15392 | 15700 | 0.0200104 | 0.0500104 |
| 0.05 | 0.03 | 15600 | 15700 | 0.0064103 | 0.0364103 |
| 0.05 | 0.03 | 15800 | 15700 | -0.0063291 | 0.0236709 |
Global imbalance
and the future of trade
I Made Krisna Gupta
November 12, 2025
Profile
I Made Krisna Gupta (Imed)
UI,DEN,CIPS
PhD in Econ at Australian National University.
Focuses on international economics and industrial policy
more at krisna.or.id or @imedkrisna
Outline
Back to basic: On the Balance of Payment
Asset theory of investment (UIP)
Global Current Account Imbalance
Going forward
US-China rivalry
The failure of WTO boils down to the US-China (and Japan before it) dynamics.
We will learn why trade war started, and will fail to solve US deficit problem.
First, we will have to learn why capital account matters to trade issues.
Goals: to understand that trade war won’t end anytime soon, unless US and/or China fix their capital imbalance.
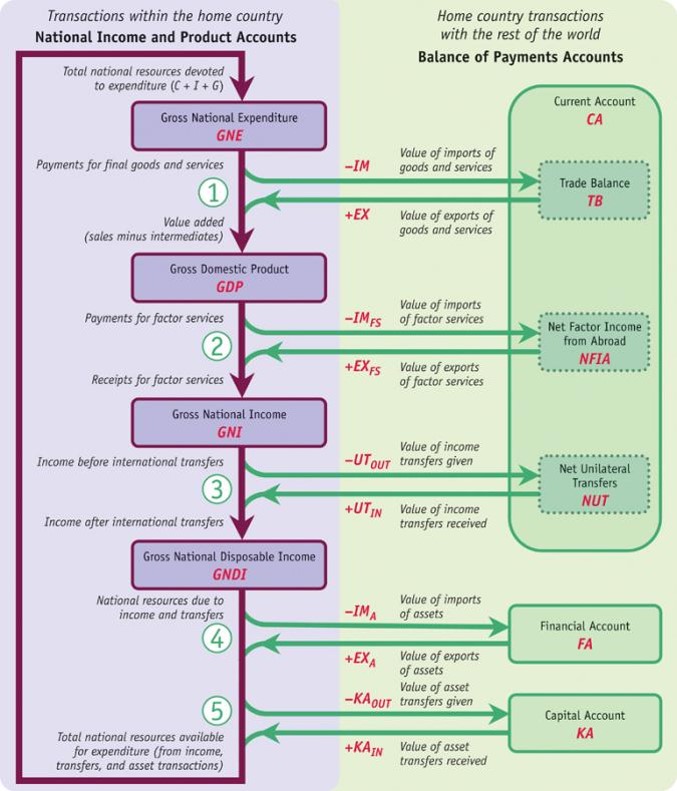
BoP
Balance of payment has current account, which includes trade balance.
Trade balance includes export and import of goods and services.
Trade balance is a part of current account.
Source: Feenstra & Taylor, International Macroeconomics
National account
Y⏟GNDI=C+I+G⏟GNE+(X−M)⏟TB+(EXFS−IMFS)⏟NFIA+(UTIN−UTOUT⏟NUT⏟Current Account (CA))
On the left is our full income measure, GNDI/GDP.
The first term on the right is GNE, which measures payments by home entities.
The remaining terms measure net payments to the home country from all international transactions in goods, services, and income. We group the three cross-border terms into an umbrella term that is called the current account (CA).
Current account
Y=C+I+G+CA
This equation is the open-economy national income identity. It tells us that the current account represents the difference between national income Y (or GNDI) and gross national expenditure GNE (or C + I + G). Hence:
GNDI is greater than GNE if and only if CA is positive, or in surplus.
GNDI is less than GNE if and only if CA is negative, or in deficit.
Current account
The current account is also the difference between national saving (S = Y − C − G, by definition) and investment:
S⏟Y−C−G=I+CA
This equation, often written as CA = S – I , is called the current account identity even though it is just a rearrangement of the national income identity.
S > I if and only if CA is positive, or in surplus.
S < I if and only if CA is negative, or in deficit.
Understanding BOP
A country with a current account surplus is a (net) lender.
By the BOP identity, it must have a deficit in its asset accounts.
Any lender, on net, buys assets (acquiring IOUs from borrowers). For example, China is a large net lender.
A country with a current account deficit is a (net) borrower.
By the BOP identity, it must have a surplus in its asset accounts.
Any borrower, on net, sells assets (issuing IOUs to lenders). As we saw, the U.S. is a large net borrower.
Understanding BOP
The balance of payments accounts consist of:
The current account, which measures external imbalances in goods, services, factor services, and unilateral transfers
The financial and capital accounts, which measure asset trades
Surpluses on the current account side must be offset by deficits on the asset side. Deficits on the current account must be offset by surpluses on the asset side.
The balance of payments makes the connection between a country’s income and spending decisions and the evolution of that country’s wealth.
Double entry
| no | example | sym | value |
|---|---|---|---|
| 1 | CA: drinks in Paris bar | −IM | -$110 |
| FA: Bar’s claim on AMEX | EXHA | +$110 | |
| 2 | CA: Arkansas wine exported to Denmark | EX | +$36 |
| CA: Jutland wine imported to United States | −IM | -$36 | |
| 3 | FA: George’s French tech stocks | −IMFA | -$10,000 |
| FA: BNP claim against Citibank | +EXHA | +$10,000 | |
| 4 | CA: Relief supplies exported to Bam | +EX | +$5,000 |
| CA: George’s charitable gift | −UTOUT | -$5,000 | |
| 5 | KA: US grant of debt relief | −KAOUT | -$1,000,000,000 |
| FA: Decline in US external assets | +EXFA | +$1,000,000,000 |
Asset side
- The Uncovered Interest Parity (UIP) equation is the fundamental equation of the asset approach to exchange rates.
iRp=i$+EeRp/$−ERp/$ERp/$
the left-hand side is the rupiah return on rupiah asset while the right-hand side is the expected rupiah return on dollar asset.
Example
where ee is the expected depreciation of rupiah while fore is the expected rupiah return on dollar asset. Any spot higher than 15392 will create an opportunity to hold dollar asset, while the opposite is true for spot lower than 15392.
Money market
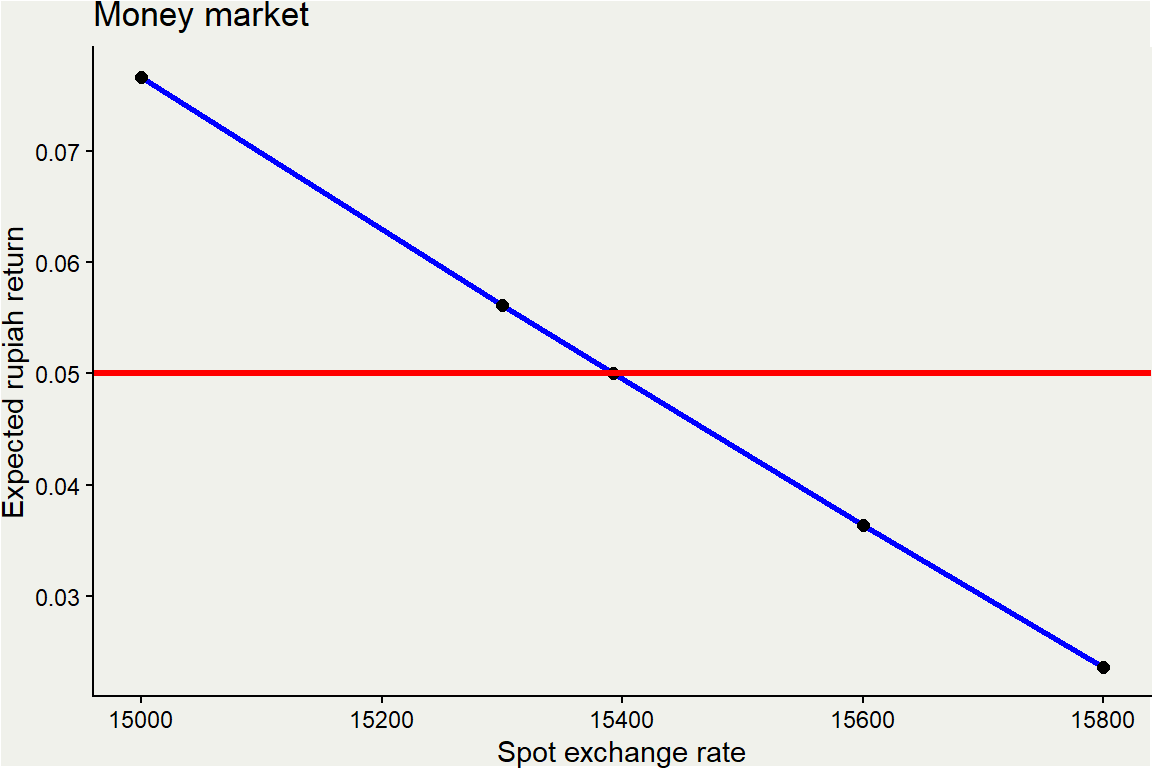
Blue line shows the rupiah return on dollar asset while the red line is the rupiah return on rupiah asset. Intersection is the equilibrium. Any point above red line is a case for holding dollar asset.
Indonesian CA
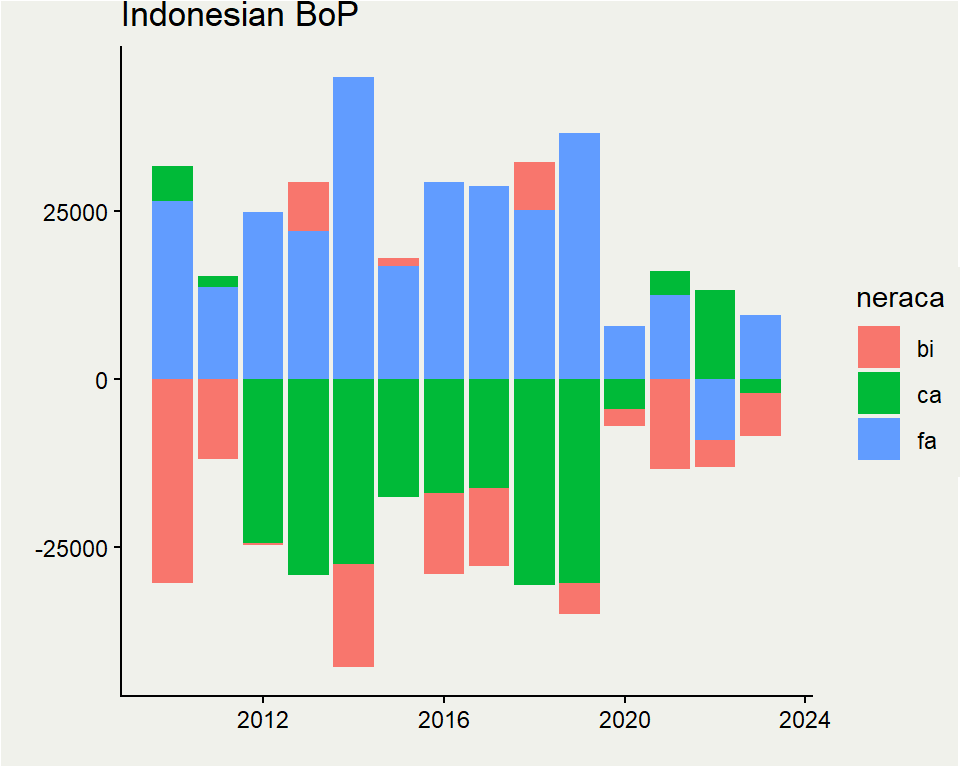
BoP always balanced by CA, FA dan reserves (CB).
Indonesia always CAD since the end of commodity boom in 2012.
Indonesia always receive investment more than it give, except in 2022.
BI is highly interventionist.
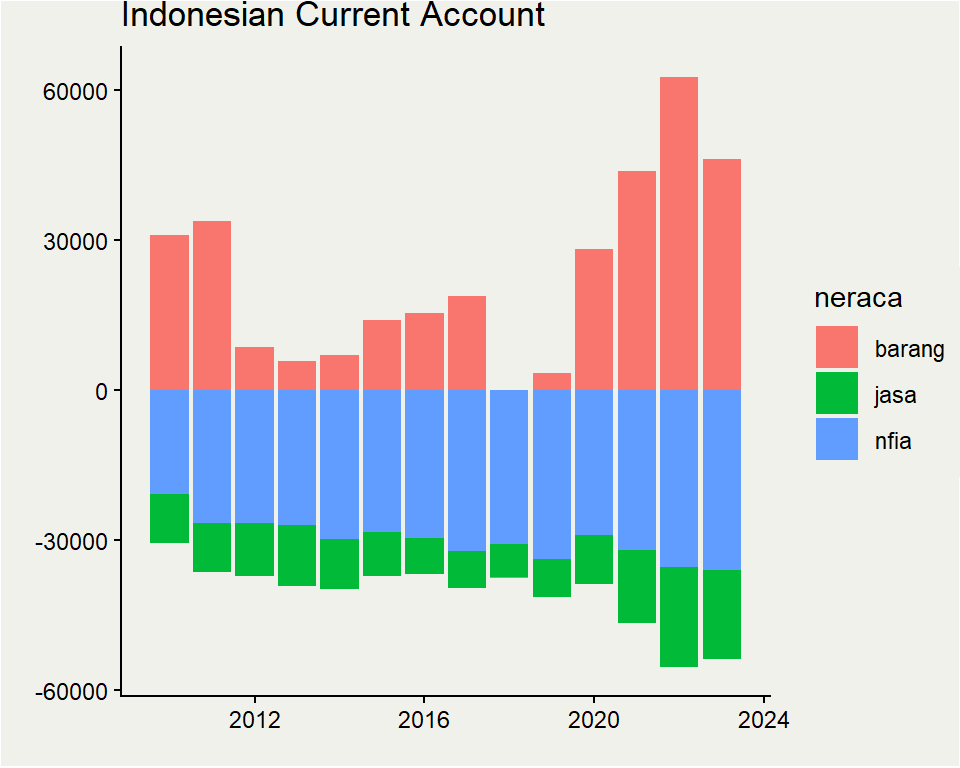
neraca trade account always surplus, but services and income transfer always deficit.
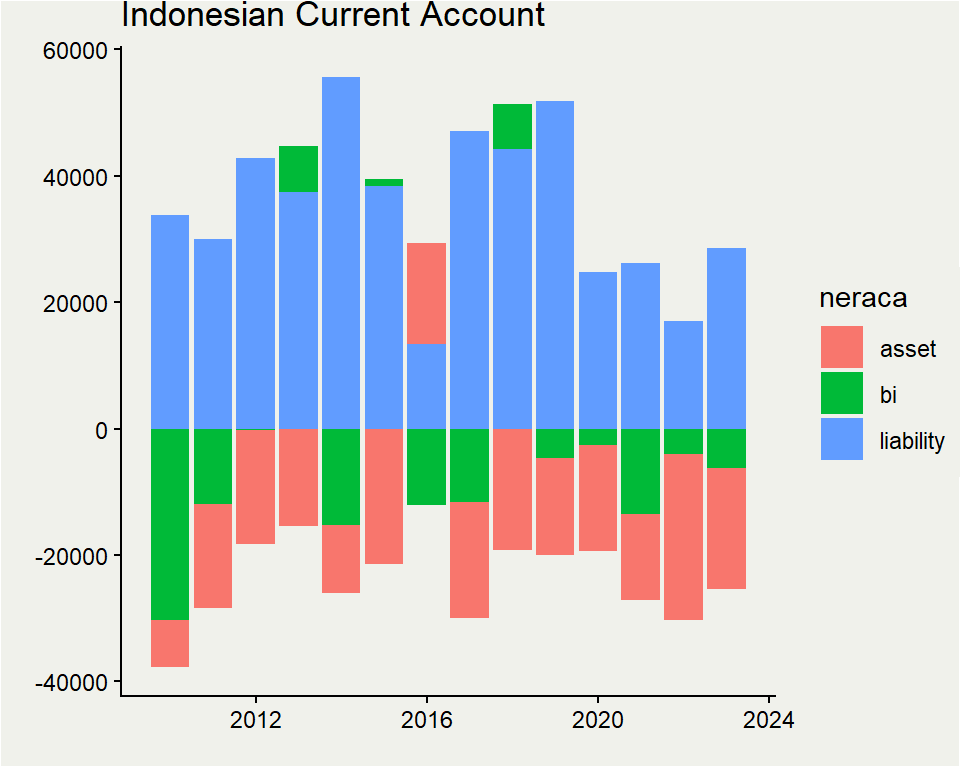
foreign investment inflow typically dominates domestic outflow but 2022.
Saving-investment (% GDP)
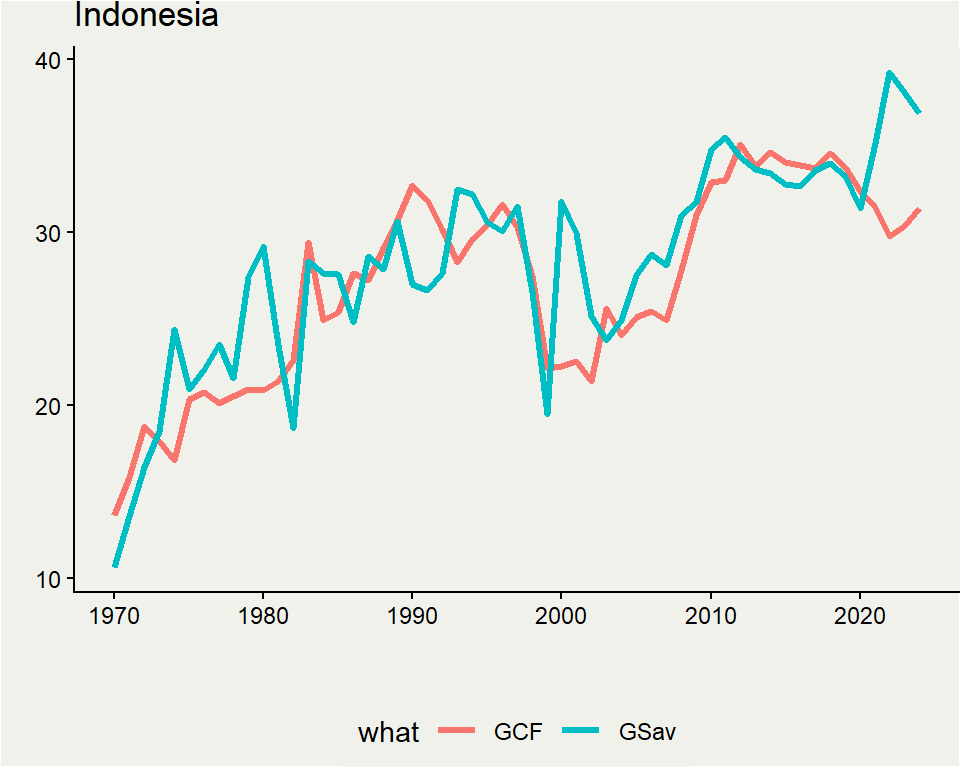
Current account balance (CAB) is simply the difference between Domestic saving (GSav) and investment (Gross Capital Formation, GCF) in Indonesia.
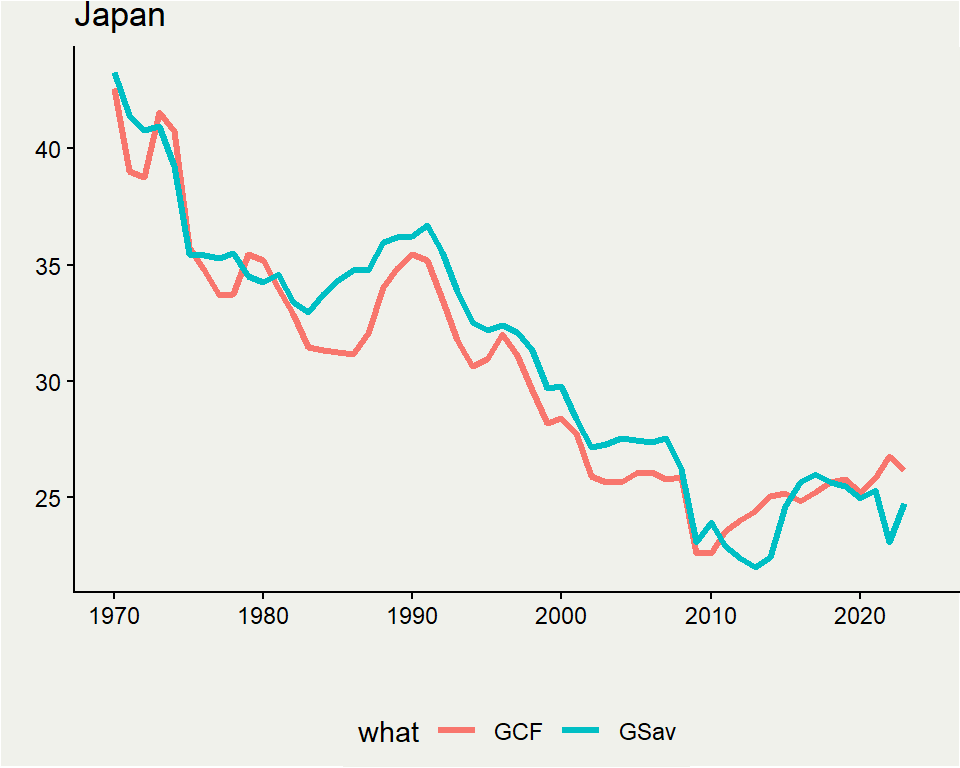
Meanwhile in Japan, saving rate keeps decreasing since 1970. However, Japan constantly see saving>investment (surplus CAB) with notable exceptions.
Saving-investment (% GDP)
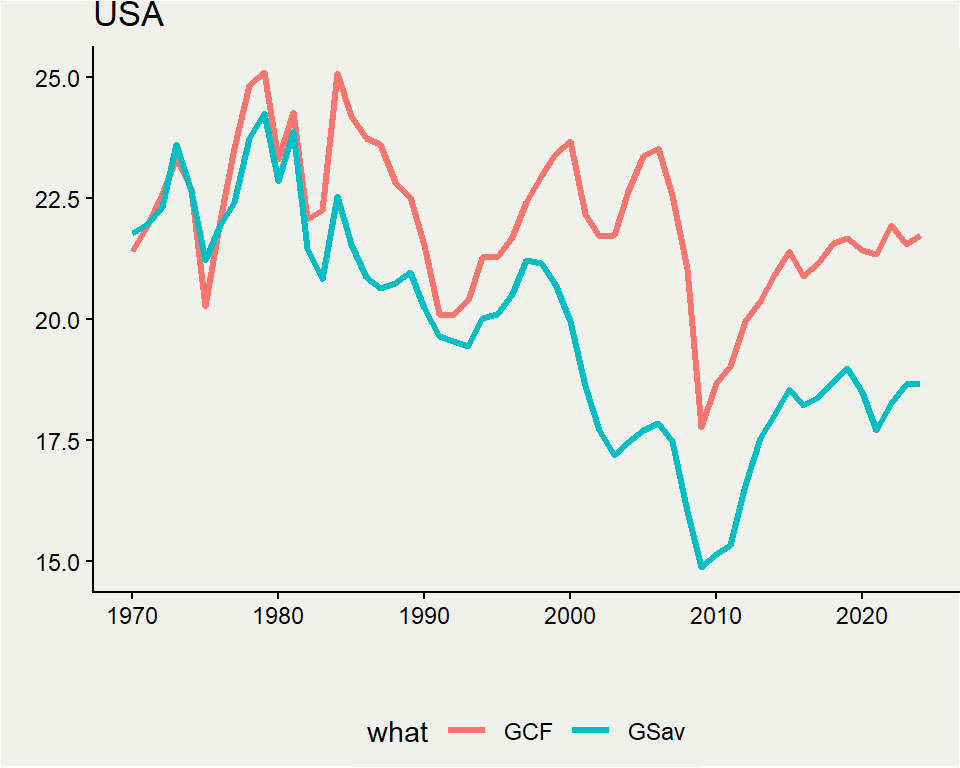
USA constantly has higher GCF compared to its saving rate. Meaning, US sees a constant CAD (current account deficit) which seems to be increasing in 2000s.
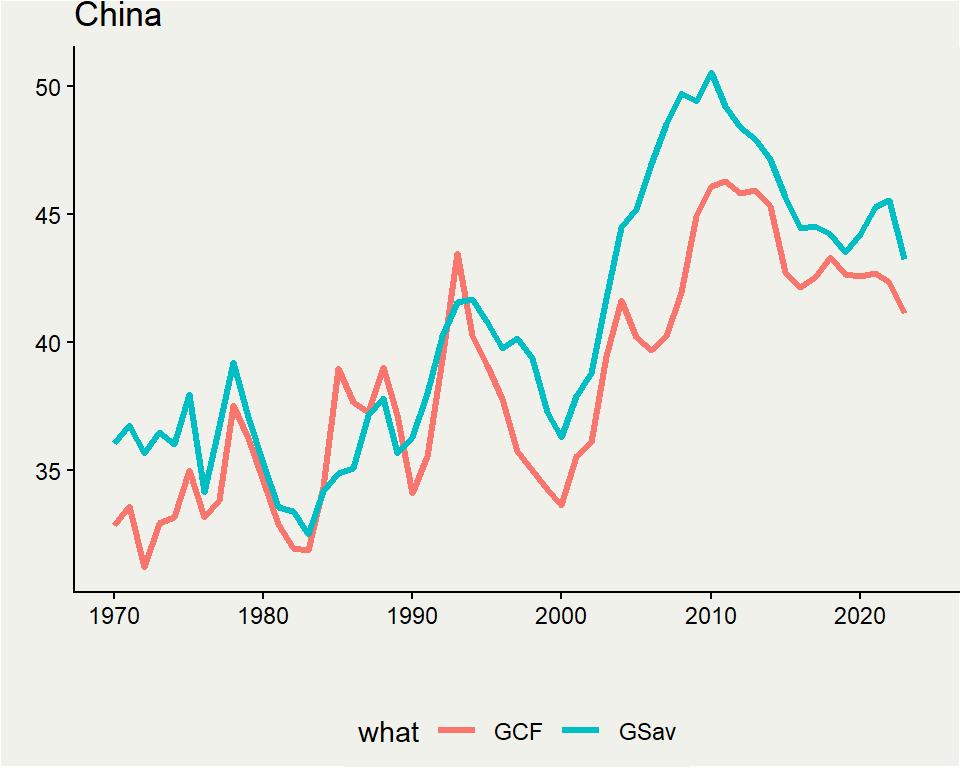
China, meanwhile, see a constant CA surplus with no notable decrease in saving rate (like Japan), but instead tend to go up (like Indonesia)
CAB
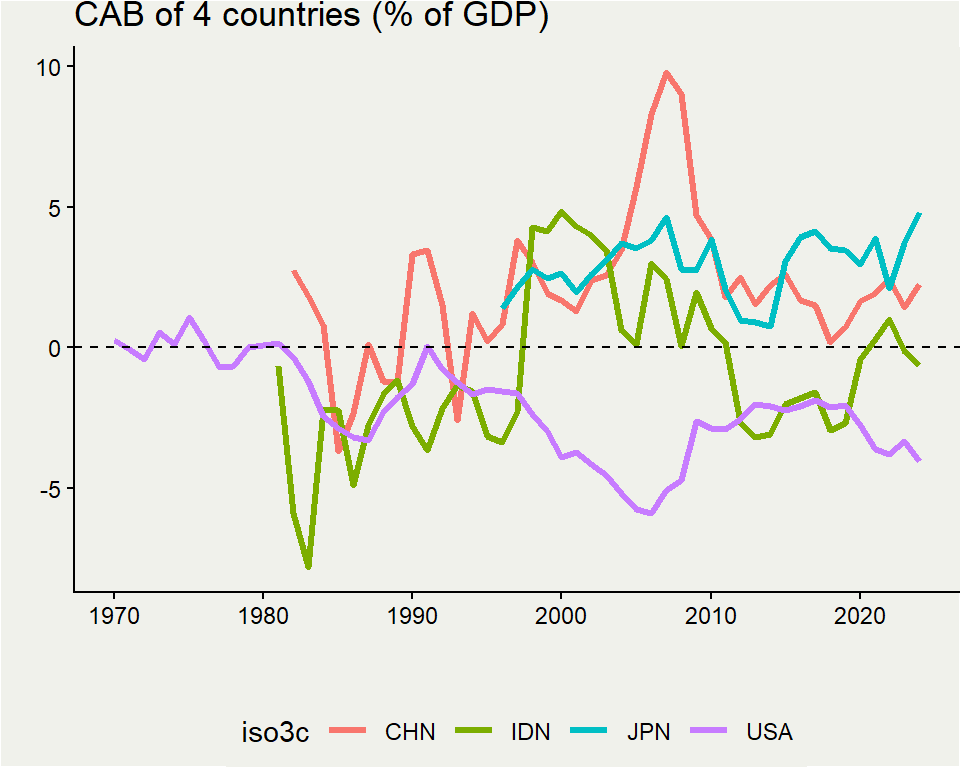
This graph shows current account balance of the 4 countries. Indonesia sees a surplus during the commodity boom, but overall moves around. China and Japan sees a constant surplus while the US a constant deficit. Japan and China = net creditors, USA = net debtor.
Going forward
The core problem is the capital flow. Will remains to be as long as:
US don’t control their deficit
China kept buying US assets, one way or another
Some blame China amid Chinese activist domestic policies, while US simply accomodate Chinese surplus.
Some blame the US for uncontrolled deficit.
Why China?
Chinese industrial policies estimated to be about 4% of its GDP
This “subsidy” is essentially transfers from government and household to firms.
China buys plenty of US debt instrument, either via PBoC or SOE banks, to keep RMB cheap.
Both rises saving rate (saving is just part of GDP not consumed), some GFCF, some abroad.
Why US
US kept increasing its debt:
- both the government by issuing securities and household via banks.
US stock market booms, which attract foreign financing.
All of these happens while US real interest rate already practically zero.
Going forward
As long as money flows to the US, it will stay deficit.
- countries are forced to negotiate with trump because US demand is important to domestic jobs.
As long as China keep its supply side instrument, it will keep producing with little domestic buyer.
- if it doesn’t sell to US, it will sell to other countries.
Trade tension will keep going up.
Global imbalance and the future of trade I Made Krisna Gupta November 12, 2025